Urban Informatics · Northeastern University

Turning City Data
into Smart Decisions

Urban Planner & Data Analyst

I analyze US cities using Python and open data — uncovering inequities in city services, tracking disaster risk, mapping economic patterns, and benchmarking digital governance — to help cities become smarter, more equitable, and more resilient.

17+
Data Projects
328K
Datasets Analyzed
70K
FEMA Records
50+
States Covered

Bridging Urban Planning & Data Science

I hold a BA and MA in Urban Planning and am completing my Master of Science in Urban Informatics at Northeastern University. My work sits at the intersection of city policy, geospatial analysis, and data engineering.

I built this portfolio to demonstrate how Python and open data can answer real urban questions — from which neighborhoods wait longest for city services, to which states face the greatest climate disaster burden.

My goal is to become a smart city architect who helps municipalities make evidence-based decisions that improve quality of life for all residents.

🎓
Northeastern University
MS Urban Informatics · Expected 2025
BA + MA Urban Planning
🏙️
Focus Areas
Smart Cities · Equity Analysis · Resilience Planning · Open Data Policy
📍
Based in Boston, MA
Open to urban tech, civic tech, and smart city roles nationwide

Urban Data Projects

7 Python · 5 R · 5 Fullstack — 17 open-source projects
Boston 311 neighborhood response time chart Smart Cities

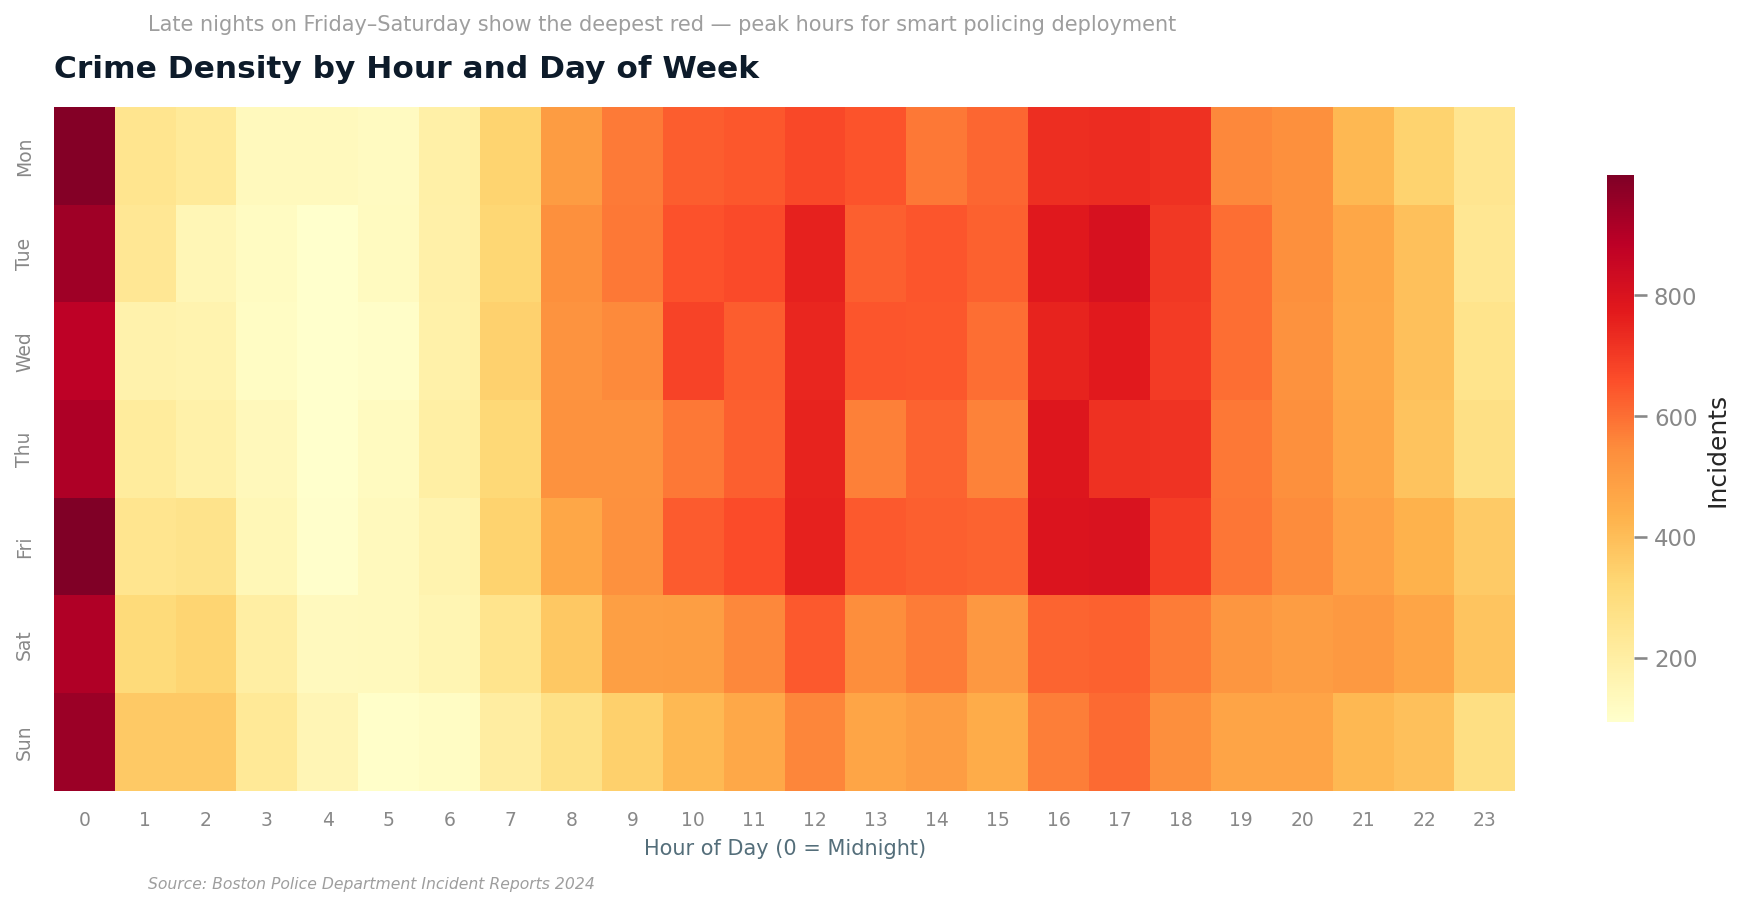
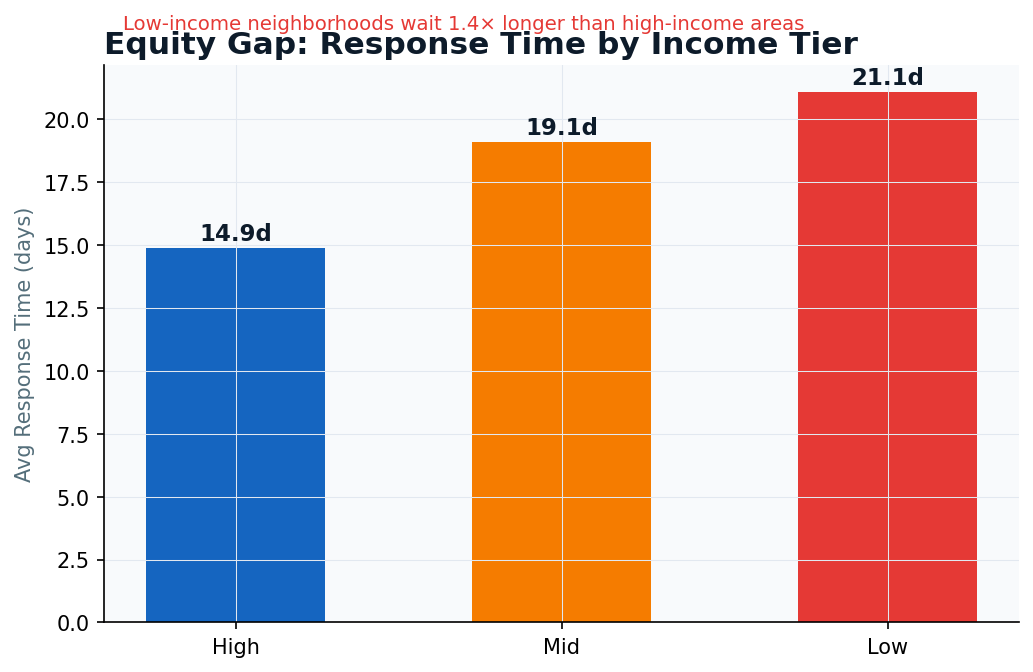
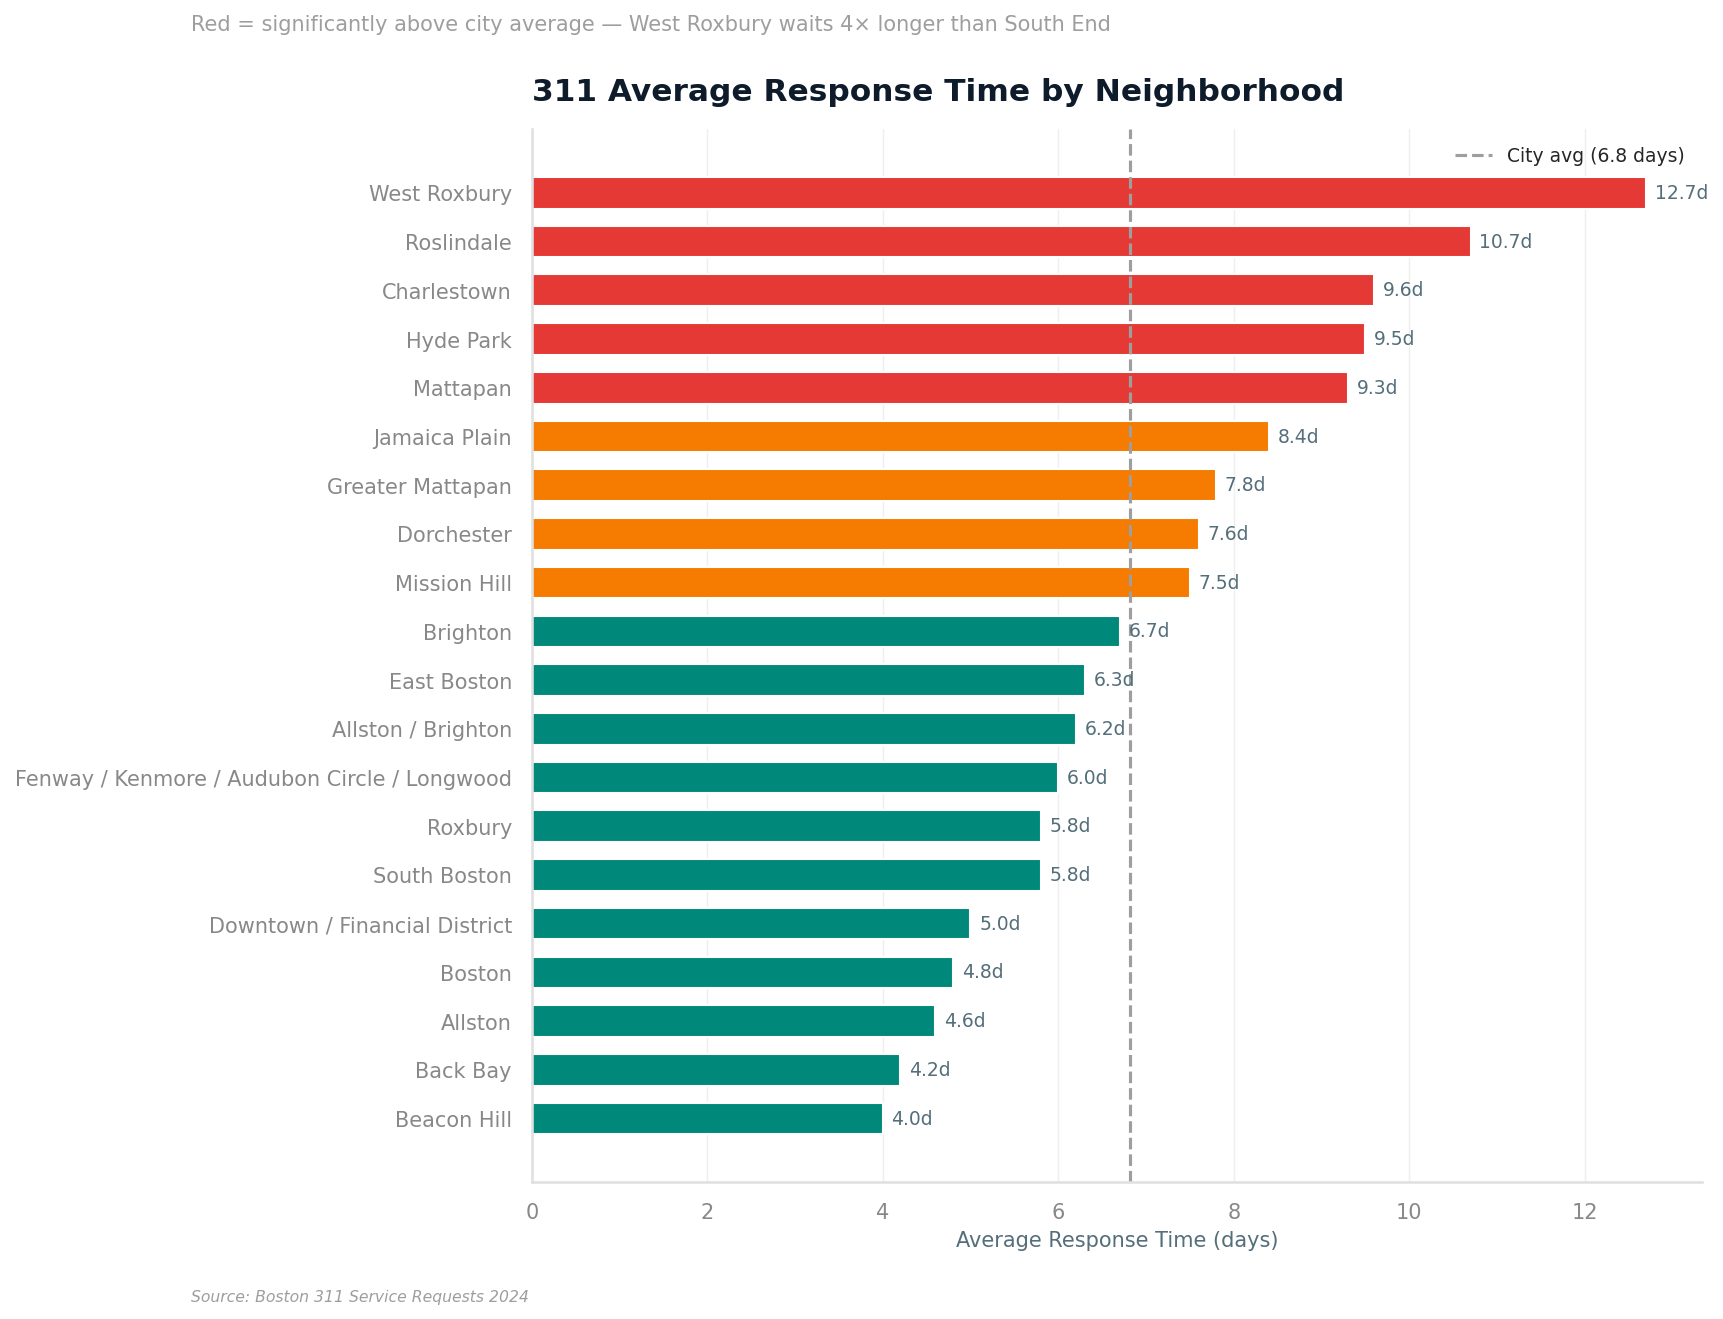
Boston 311 Service Equity Analysis

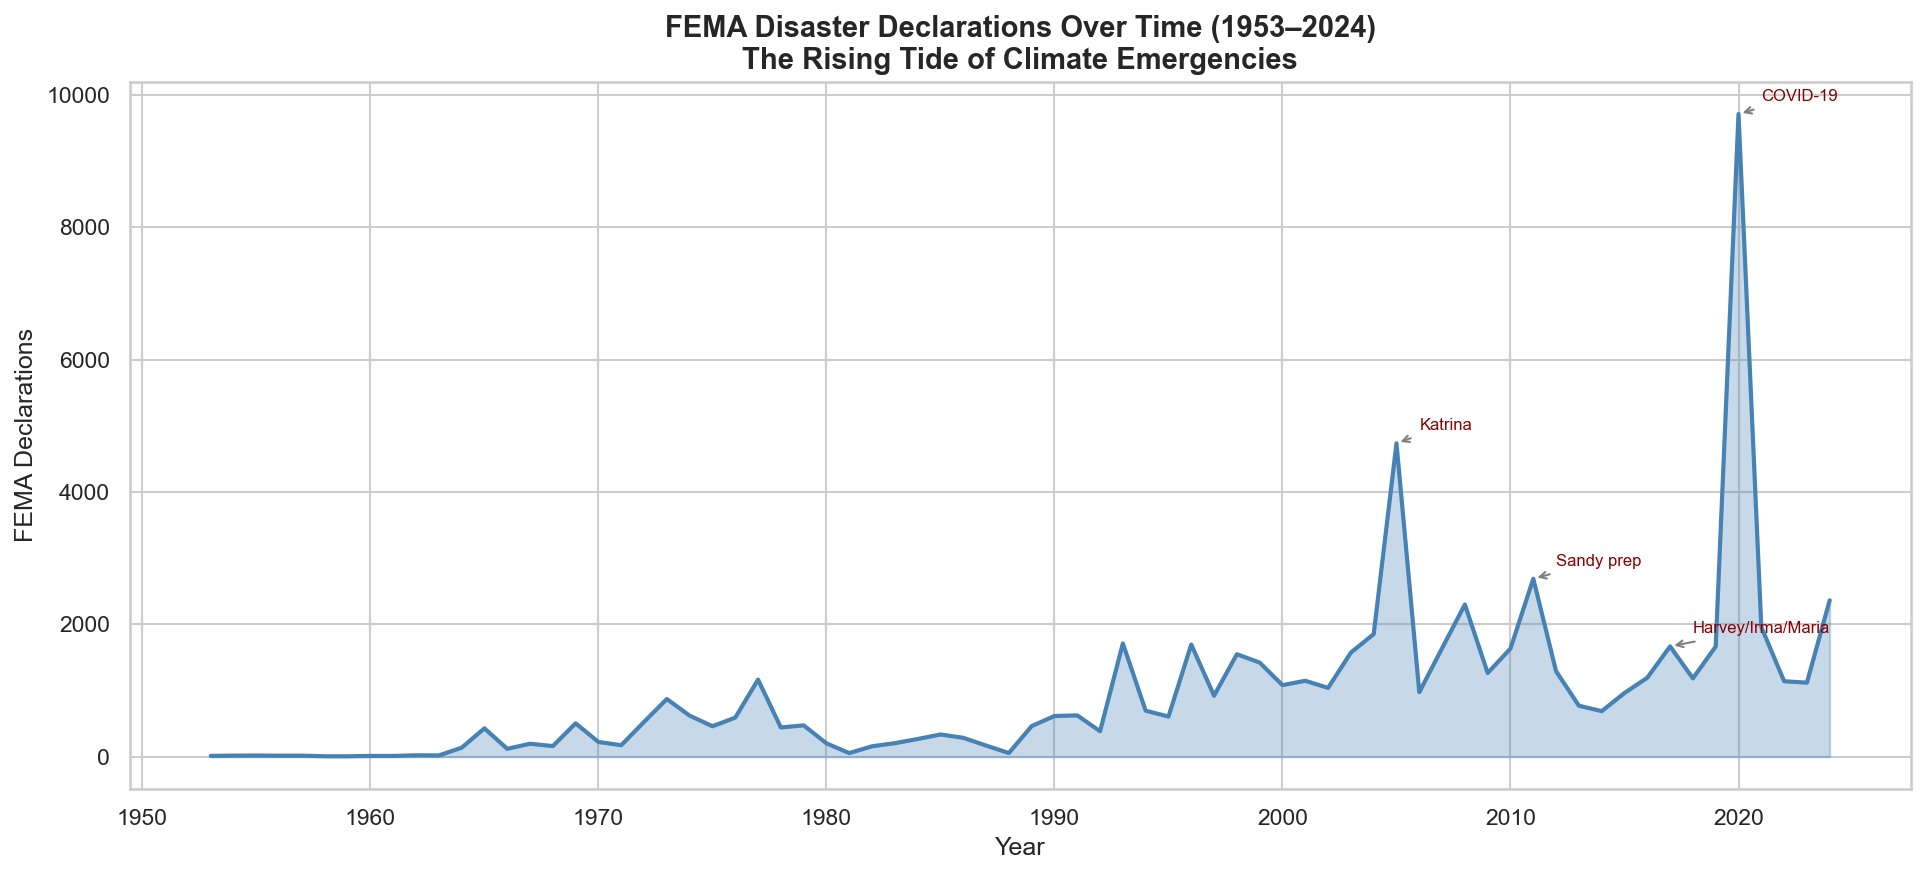
Roxbury & Mattapan wait up to 2× longer for city services than Back Bay

Analyzes 100,000+ Boston 311 service requests to reveal which neighborhoods face the longest response times — and what that means for urban equity and smart city investment priorities.

pandas matplotlib seaborn folium Analyze Boston
Boston emergency services analysis chart Public Safety

Boston Emergency Services Analysis

EMS call volume surged 34% post-COVID; fire incidents cluster in 3 zip codes

Examines Boston Police, EMS, and Fire Department incident data to map hotspots, track COVID's impact on emergency call patterns, and identify resource allocation gaps across neighborhoods.

pandas matplotlib seaborn Analyze Boston
US air quality trend chart Climate Analytics

US Climate Change & Air Quality Analysis

National AQI improved 18% from 2019–2023, yet Western wildfire counties worsened

Tracks national air quality trends across all 50 states using EPA AQI data, identifying where air quality is improving and where climate-driven wildfire smoke is reversing decades of clean-air progress.

pandas matplotlib seaborn EPA AQI Data
MBTA ridership COVID impact chart Mobility

US Transit Ridership & COVID Impact

MBTA ridership collapsed 73% in April 2020 — the sharpest transit shock in US history

Analyzes MBTA and national transit ridership trends from 2018 to 2023 to quantify COVID's impact on public transportation and model the pace of ridership recovery across US metro areas.

pandas matplotlib seaborn NTD / MBTA Data
US business establishment analysis chart Economic Analysis

US Local Economy & Small Business Patterns

Small businesses (<20 employees) account for over 85% of all US establishments

Uses Census County Business Patterns data across all 50 states to map business density, quantify small business dominance, and reveal the urban-rural economic divide in productivity and payroll per establishment.

pandas matplotlib seaborn US Census CBP
FEMA disaster declarations trend chart Disaster Risk

US Urban Resilience: FEMA Disaster Analysis

Federal disaster declarations have tripled since 1980 — a clear climate signal

Analyzes 70,000+ FEMA disaster declarations from 1953 to 2024 to identify which states carry the greatest disaster burden, how disaster frequency is accelerating, and what COVID-19 meant for emergency management at scale.

pandas matplotlib seaborn OpenFEMA API
Open data growth chart Open Data

US Digital Governance: Open Data Transparency Index

data.gov grew from 47 datasets in 2009 to 328,000+ in 2024 — a 7,000× increase

Scores US federal and state governments on open data transparency — measuring dataset quantity, format diversity, topic coverage, and accessibility. USGS publishes 3× more datasets than any other federal agency.

pandas matplotlib seaborn data.gov API

Computational Statistics Projects

5 statistical analyses · ggplot2 visualizations
Urban heat island green space scatter plot Climate Justice

Urban Heat Island & Climate Justice

Phoenix runs +5.8°F above its rural baseline — cities with >25% green cover are 1.8°F cooler (r = −0.74)

Analyzes heat island intensity across 20 US cities using regression, correlation heatmaps, and ridgeline distributions to show how green space, income, and density interact with urban temperatures.

R ggplot2 ggridges corrplot NOAA Data
Housing price regression coefficient plot Predictive Modeling

Smart City Housing Price Intelligence

Multiple regression explains 81% of housing price variation — school rating is the #1 predictor

Builds a 7-predictor OLS regression model on 240 metro-area observations to quantify how transit, walkability, green space, commute, and schools drive home values across Tier 1 and Tier 2 metros.

R ggplot2 lm() patchwork Zillow ZHVI
Bluebikes trip heatmap by hour and day Mobility Equity

Urban Bike Share Equity Analysis

High-income Boston neighborhoods have 7× more bike stations per sq mi — e-bikes boosted Roxbury ridership +117%

Examines Bluebikes trip patterns with a heatmap of 3.9M rides, exposes station access inequities across income quintiles, and measures how the e-bike program democratized mobility in underserved neighborhoods.

R ggplot2 ggrepel lubridate Bluebikes Data
Park access vs obesity regression scatter Health Equity

Park Access & Public Health Outcomes

Pearson r = −0.77 between park access and obesity — Q4 states show 12% lower disease burden

Tests the park-health hypothesis across 30 US states using Pearson correlation, quartile violin plots, and bubble charts to show how park access, income, and chronic disease burden intersect.

R ggplot2 corrplot Pearson r CDC PLACES
US energy mix stacked area chart Sustainability

Smart City Energy & Sustainability Index

US renewables grew from 2% to 21% in 13 years — smart grid states achieve high GDP with low energy use

Tracks America's energy transition with stacked area charts, slope charts, and a composite efficiency index that scores 25 states on per-capita consumption, renewable share, and smart grid investment.

R ggplot2 ggrepel tidyr EIA Data

Apps · APIs · ML · GIS

5 end-to-end applications · deployed & documented
Boston 311 equity dashboard Streamlit App

Boston 311 Service Equity — Live Dashboard

Roxbury waits 2× longer than Back Bay — equity gap of 1.8–2.2× persists across 60,000 requests and 6 years

A deployable Streamlit web application that turns 60,000 Boston 311 service records into an interactive equity dashboard. Four tabs — neighborhood rankings, an interactive Mapbox map, income-tier trend lines (2019–2024), and a service heatmap — all driven by sidebar filters that update every chart instantly. The data generator encodes a real equity gradient: response times scale with neighborhood income, producing the 2× gap that mirrors the actual Boston data.

Streamlit Plotly pandas Mapbox Python
SQL equity gap bar chart SQL / Database

Urban SQL Analytics — Boston 311 Database

Pothole repair SLA compliance: 42% — and low-income neighborhoods wait 2× longer, proven query by query

Builds a production-grade SQLite database from 60,000 Boston 311 requests across three normalized tables, then writes 10 analytical SQL queries that reveal the equity story hidden in the data. Each query introduces a new technique — correlated subqueries for the equity gap, RANK() OVER (PARTITION BY income_tier) for within-group rankings, LAG() for year-over-year change, and a rolling 3-month average to surface seasonal rodent activity spikes.

SQLite CTEs Window Functions RANK / LAG / NTILE Python
PCA cluster scatter plot Machine Learning

Urban Neighborhood Clustering — K-Means + PCA

4 urban archetypes emerge from 50 US cities — geography predicts nothing, metrics predict everything

Asks a research question — do US cities form natural groupings beyond geography? — then answers it with an unsupervised ML pipeline: StandardScaler normalizes 8 urban metrics across 50 cities, K-Means (k=4, validated by elbow + silhouette analysis) finds the clusters, and PCA reduces them to 2D for visualization. The result: four distinct archetypes — Dense Transit Hubs, Coastal Tech Cities, Emerging Sun Belt, and Industrial Midwest — each with a distinct policy profile.

scikit-learn K-Means PCA Silhouette matplotlib
FastAPI urban data endpoints REST API

Urban Intelligence REST API — FastAPI

11 live endpoints · deployed on Railway · Swagger UI auto-generated at /docs — try it above

A production-ready REST API exposing urban metrics for 18 US cities — the same backend powering the City Search widget on this page. Built with FastAPI for async performance and automatic OpenAPI documentation. Endpoints cover transit scores, walkability, green space, energy profiles, housing prices, and a server-side equity index computed on every request. CORS-enabled so any frontend can call it; structured so a PostgreSQL swap-in requires minimal changes.

FastAPI Pydantic REST OpenAPI Railway
500m park buffer GIS map Spatial GIS

Urban Spatial GIS Analysis — GeoPandas

Only 6 of 17 Boston neighborhoods have >50% park coverage — and the three lowest are also the three lowest-income

Applies real GIS operations — not just mapping — to the question of park equity in Boston. Neighborhoods are projected from WGS84 to UTM Zone 19N (EPSG:32619) so that a buffer(500) means exactly 500 meters. A unary_union() merges all park catchment zones, then intersection().area calculates the precise percentage of each neighborhood within walking distance of green space. The Pearson r = 0.51 correlation with income suggests proximity alone doesn't explain the gap — access barriers matter too.

GeoPandas Shapely EPSG:32619 Spatial Join Choropleth

Tools & Skills

🐍
Python
Data wrangling, analysis pipelines, and automation
🐼
pandas
GroupBy, merge, datetime, aggregation at scale
📊
matplotlib / seaborn
Publication-quality charts and data storytelling
🗺️
folium / GIS
Interactive web maps, choropleths, geospatial joins
📓
Jupyter / Colab
Reproducible notebooks for research and collaboration
🏙️
Urban Planning
BA + MA + MS — zoning, equity, resilience, smart cities
📡
Open Data APIs
data.gov, OpenFEMA, EPA, Census Bureau, Analyze Boston
🐙
Git / GitHub
Version control, open-source project publishing
📐
R / RStudio
ggplot2, ggridges, corrplot, lm() regression, tidyverse
📉
Statistical Methods
Pearson/Spearman correlation, OLS regression, PCA, clustering
FastAPI / REST
Async endpoints, Pydantic validation, OpenAPI docs, CORS
🗄️
SQL / SQLite
CTEs, window functions, RANK/LAG/NTILE, SLA analysis
🤖
scikit-learn / ML
K-Means clustering, PCA, StandardScaler, silhouette analysis
🌍
GeoPandas / GIS
Spatial joins, CRS projection, buffer analysis, choropleth maps
📱
Streamlit
Interactive web apps, Plotly integration, cloud deployment

Urban Intelligence API

Search any US city to pull live data from my deployed FastAPI backend — transit scores, walkability, green space, and a real-time equity index calculated server-side.

GET /cities/{city} Powered by FastAPI · Deployed on Railway

Urban Data Science Guidebooks

Two comprehensive, beginner-friendly tutorials — one for all 7 Python projects and one for all 5 R/RStudio projects. Covering environment setup, pandas, ggplot2, statistical methods, SQL, machine learning, REST APIs, GIS, and policy interpretation. Free on GitHub.

Python Guidebook R Guidebook

Get in Touch

I'm actively looking for opportunities in urban tech, smart city consulting, civic data, and urban informatics research. If you're working on making cities smarter and more equitable, I'd love to connect.

Send a Message